Histogram
A histogram is a bar chart that focuses on the frequency of a value occurring. The vertical axis of a bar chart does not refer to another value, but rather the # of instances of the horizontal axis value. The arrangement of the horizontal axis varies depending on intended focus.
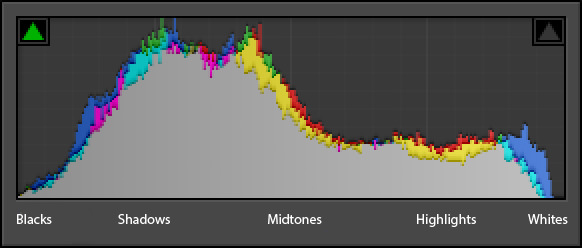 The histogram is often used in photography as a method to represent the tonal distribution of an image.
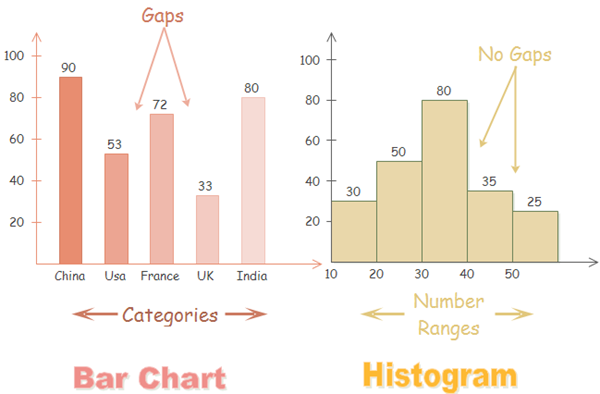 The histogram focuses on on a continuous range of data, with each value "bin" representing a smaller range of that date. A bar chart, while similar visually, instead focuses on a plot of variable categories. In order to further differentiate the two visually, often a histogram's vertical bars are adjacent to each other (in order to represent that it is a continuous range of data), while a bar chart's bars are separate to indicate the different categories of each bar.

While the histogram does not break down each bin into a category, those categories can be represented via a vertical stacking of the bins. In this chart, the individual vertical breakdown is clear.
 While the overall frequency breakdown of this chart is easy to read, the individual breakdown of each frequency into teams is difficult due to the large number of individual portions, the similarity of the colors, and lack of correlation between colors and team name's in consideration of their logos/identities (which would increase understanding).