Survey Plot & Permutation Matrix
Survey Plots:
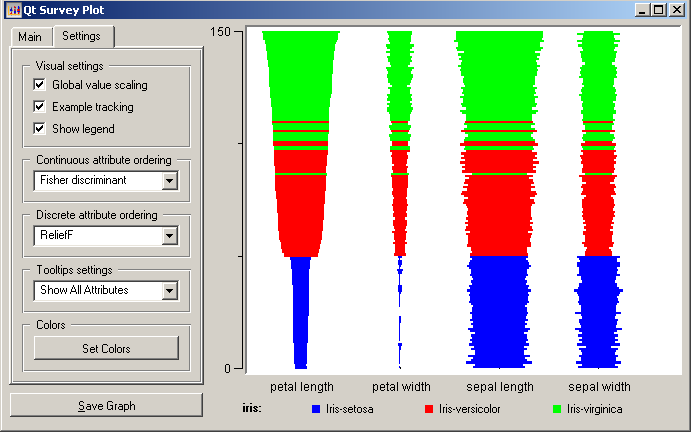
Survey plots are a bi-axis data visualization form. They contain a large number of columns and rows and its information can be read laterally. Survey plots are best utilized when trying to find and or display correlations between large groups of data. One should employ survey plots when working with big data rather than small values as the large number of columns and rows can render the data illegible when searching for specific values.
Permutation Matrix:
Like Survey Plots, Permutation matrix are utilized to find correlation between information. Also known as Bertin's permutation matrix, they occur when information from a Bertin Matrix is re-arranged to showcase information of interest. The areas of interest are usually at the top of the graph while the rest of the information is rearranged and correlated based on the primary interest. Just like the Survey Plots, Permutation matrices should not be used so individual values as they are meant for big data analysis.
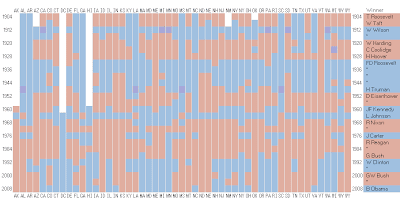
In the examples below a hotel owner re-arranged his matrix in order to find correlation between the information
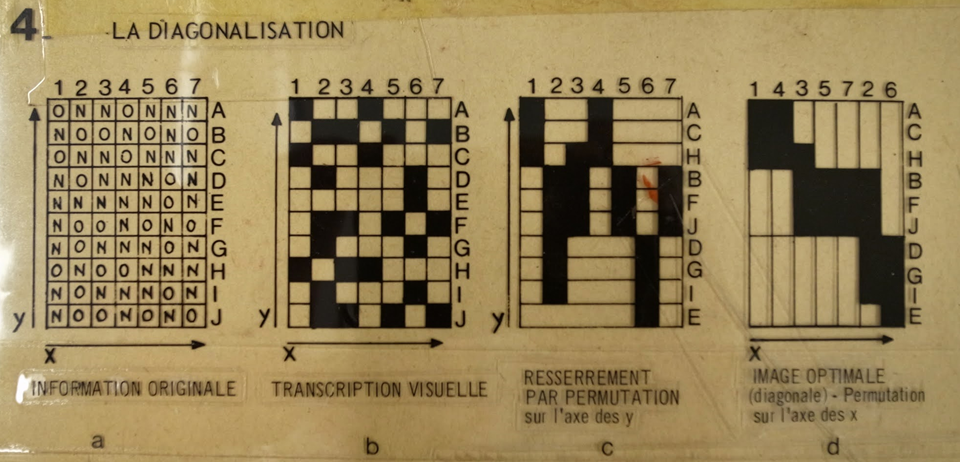
 Original Matrix
 Rearranged Matrix
 Example of variables
RedvsBlue Elections by State
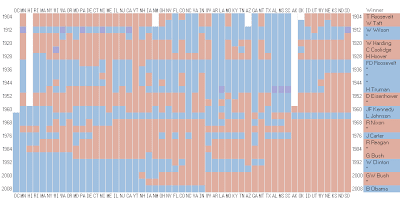
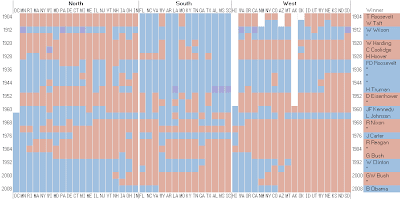
Alternative Format
sources:
https://ldld.samizdat.cc/2016/test-post/
http://docs.orange.biolab.si/2/_images/SurveyPlot-Settings.png
http://www.statlab.uni-heidelberg.de/projects/bertin/permutation01.html
http://www.statlab.uni-heidelberg.de/projects/bertin/
http://i-ocean.blogspot.com/
http://www.aviz.fr/diyMatrix/