tree + graph visualisation
tree
Tree visualisation graphics is hierarchical data drawn with lines and connecting "branches". Trees are a commonly used form of data as many data sets have a hierarchical structure, however, even though the data is hierarchic his is not the proper representation. It is not easy to associate the exact extent of the hierarchy in this form of data. Tree graphics can present changes in types of data through thickness, length or colour of line. However this can be hard to present in a visually accurate way.
The two images below present clear presentations of how this information can be layed out as a tree.
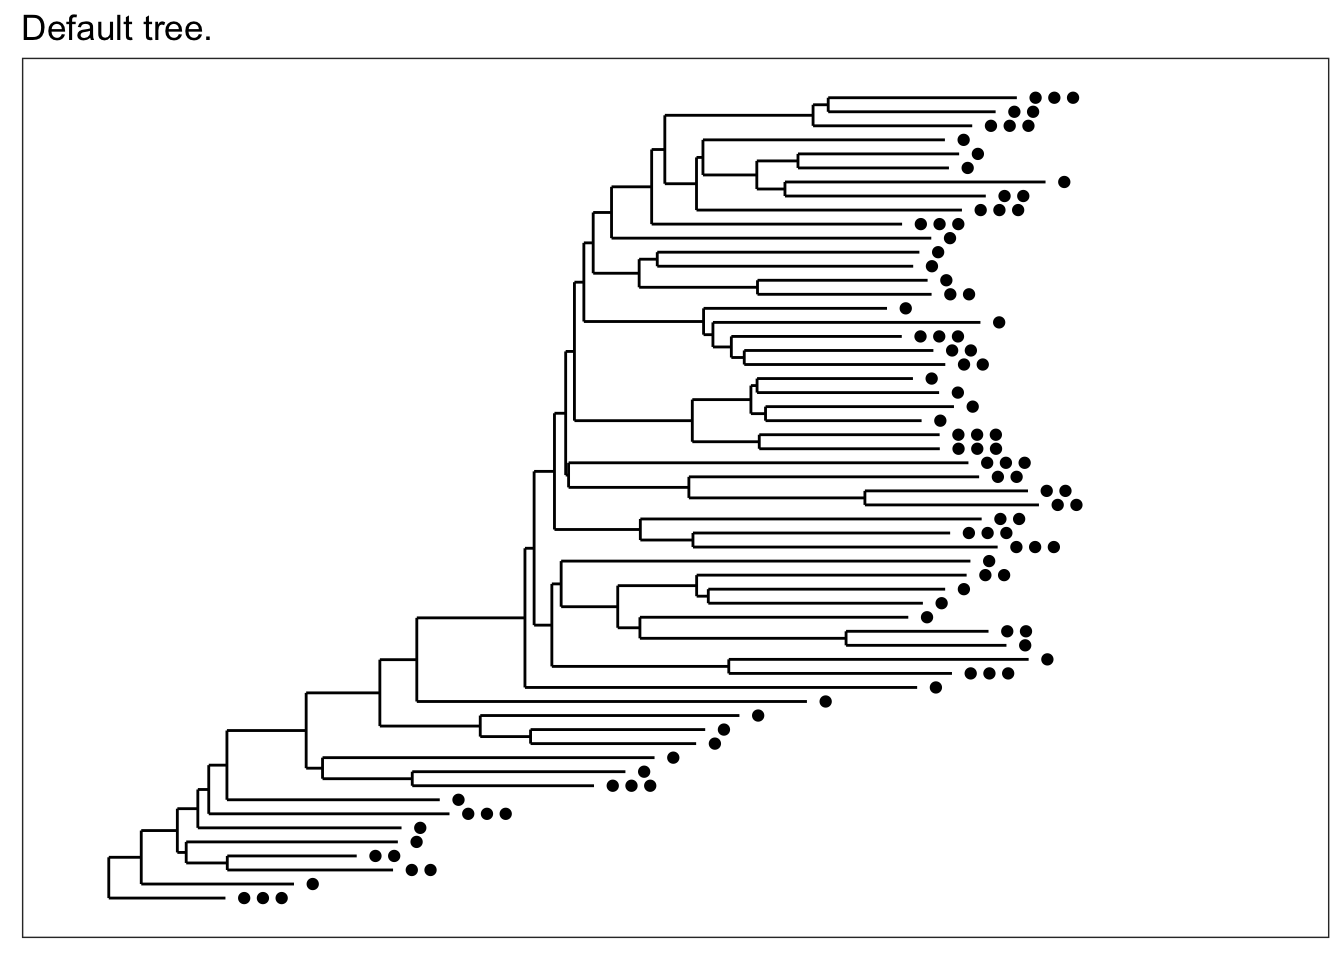

 The one above is especially clear at showing how the branches can be visually manipulated to create hierarchy.

graph
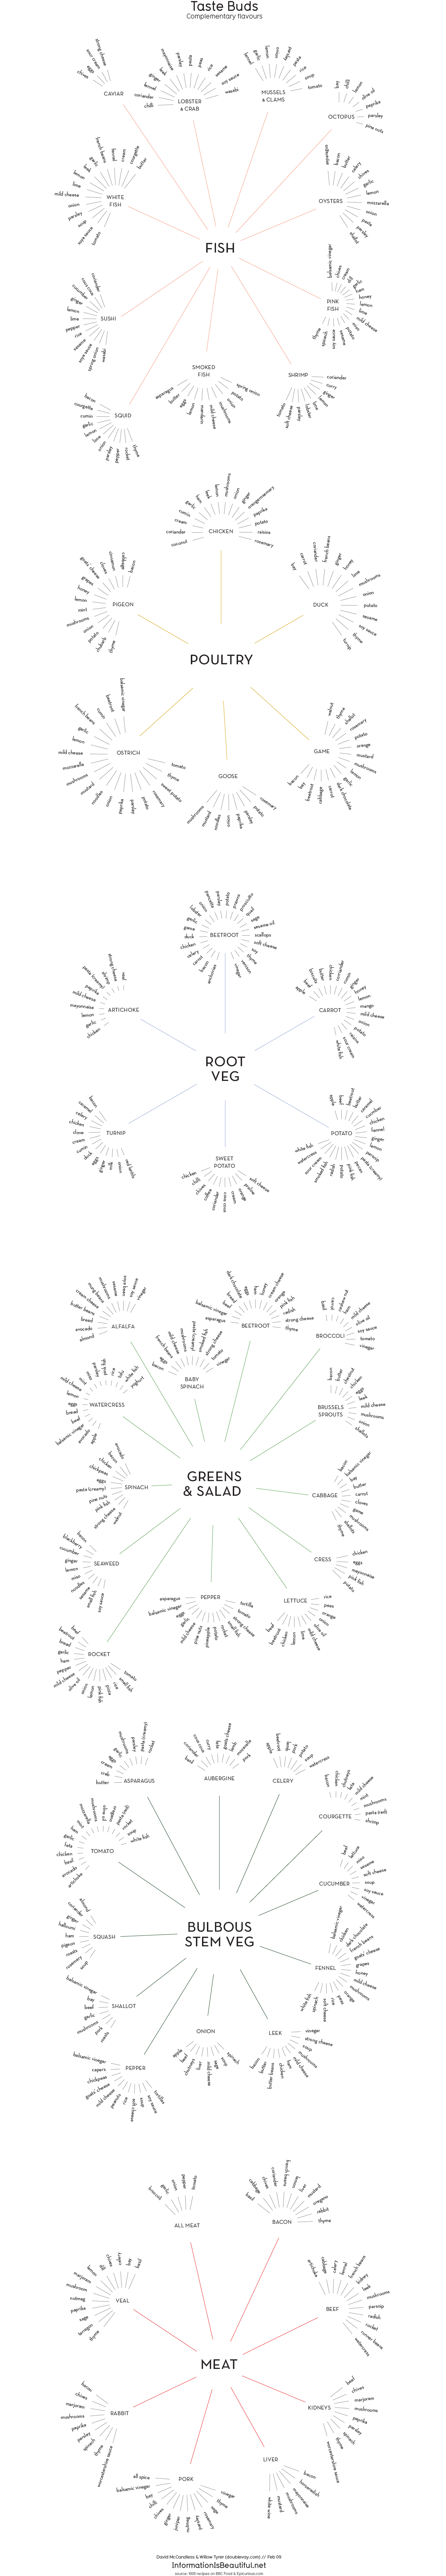
Graph visualisation graphics is a form of tree visualisation graphic which has less order. It can connect back to itself rather than "growing" linearly. Rather than being based on hierarchy it is a collection of nodes and branches that connect between themselves.
The image below presents the benefit of the graph tree visualisation form which differs in the sense that information and ends of branches can be connected to one another.


