Box Plots
Introduced in 1977 by mathematician John Tukey, the box plot is a two-part depiction of a given data set, using a central "box" and two lines, often called "whiskers." The box shows the set's median, as well as first and third quartile values, typically distributed over a vertical axis. The whiskers, which protrude on the top and bottom of the box, can be used in a variety of ways – most commonly to show the minimum/maximum of a set, or one standard deviation above and below the "box."
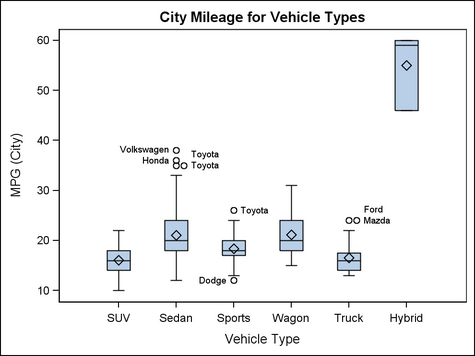
Box plots have the ability to represent a variety of characteristics of a given set in a succinct manner, as well as compare multiple sets to one another (as seen in the image below). There are at least five relevant pieces of information per set (six if there is a signifier of a set's mean), making them extremely thorough compared to one-dimensional data visualizations such as pie charts or histograms. That said, given the amount of data points per set, box plots can become difficult to follow if many sets are being compared on the same plot.
It appears that box plots are used primarily by scientists/statisticians as a pragmatic way to interpret and display data, and less so by popular news outlets. As a result, it is difficult to find a "bad" box plot - perhaps because the comprehensiveness of box plots makes them borderline foolproof to malicious manipulation.
///////////////////////////////////////////////
Below is a box plot that displays data on airline departure delays over the course of twelve days. While the median barely deviates over the course of the study, the obvious change in maximum value could imply a negative pattern that isn't particularly relevant to travelers.

Above is an example of a box plot being used as a complement to a histogram. Because box plots address many different data points, it can be useful to focus on one particular attribute and use a box plot as a separate device to visualize the data set as a whole.
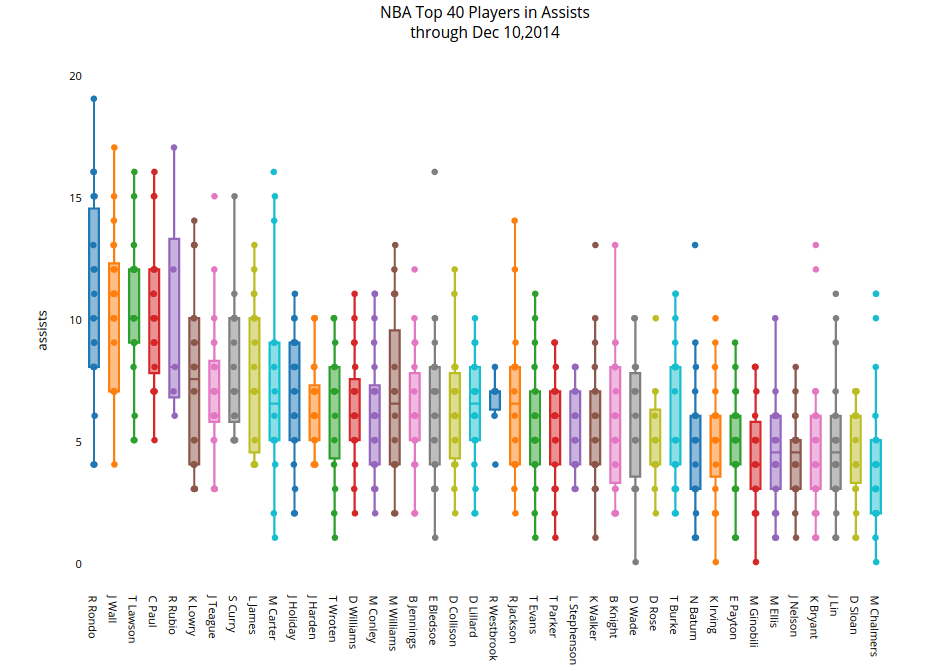
Below is, in my opinion, an example of a box plot containing too many data sets, making it difficult to intuit/digest ––