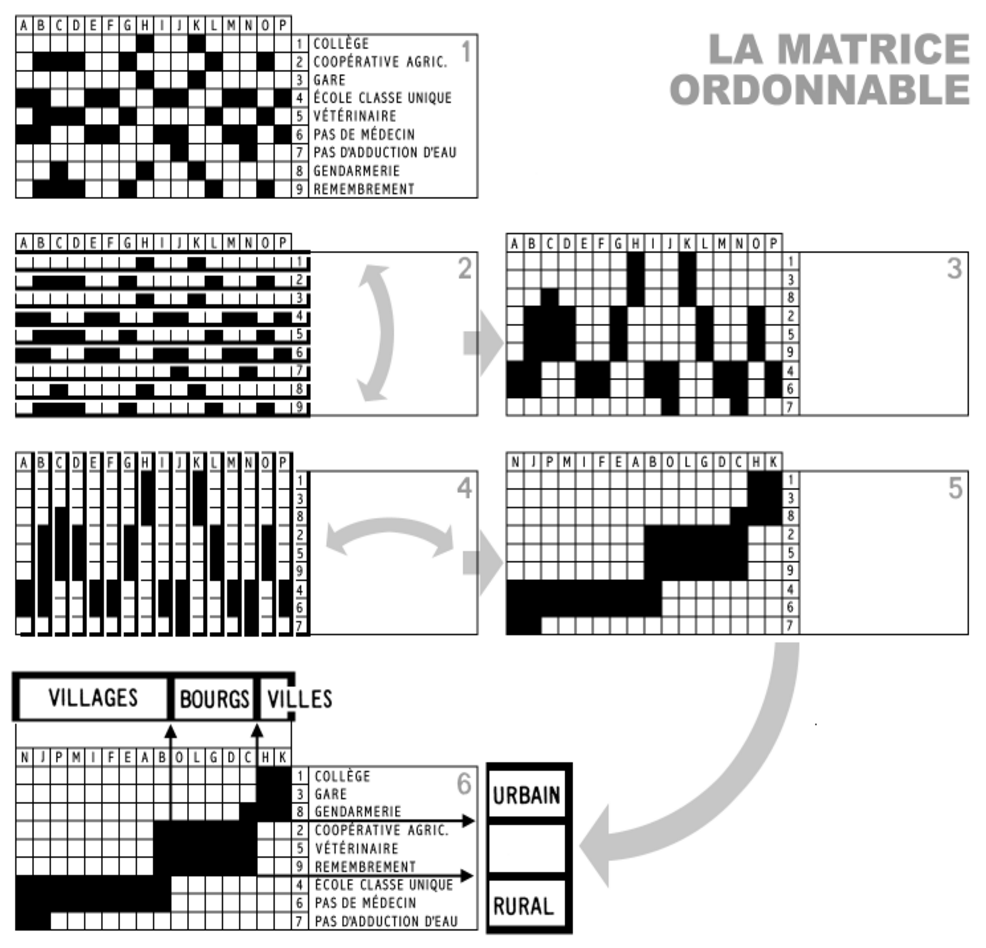
permutation matrix
Bertin's sortable bar charts for the display of multi-dimensional data
features
- Allows arrangements to transform initial matrix - can rearrange rows/columns to reveal information of interest.
- Visual comparison of data to reveal or prove insights.
- Custom organization of data help communicate insights with efficiency.
- Work flow:
examples
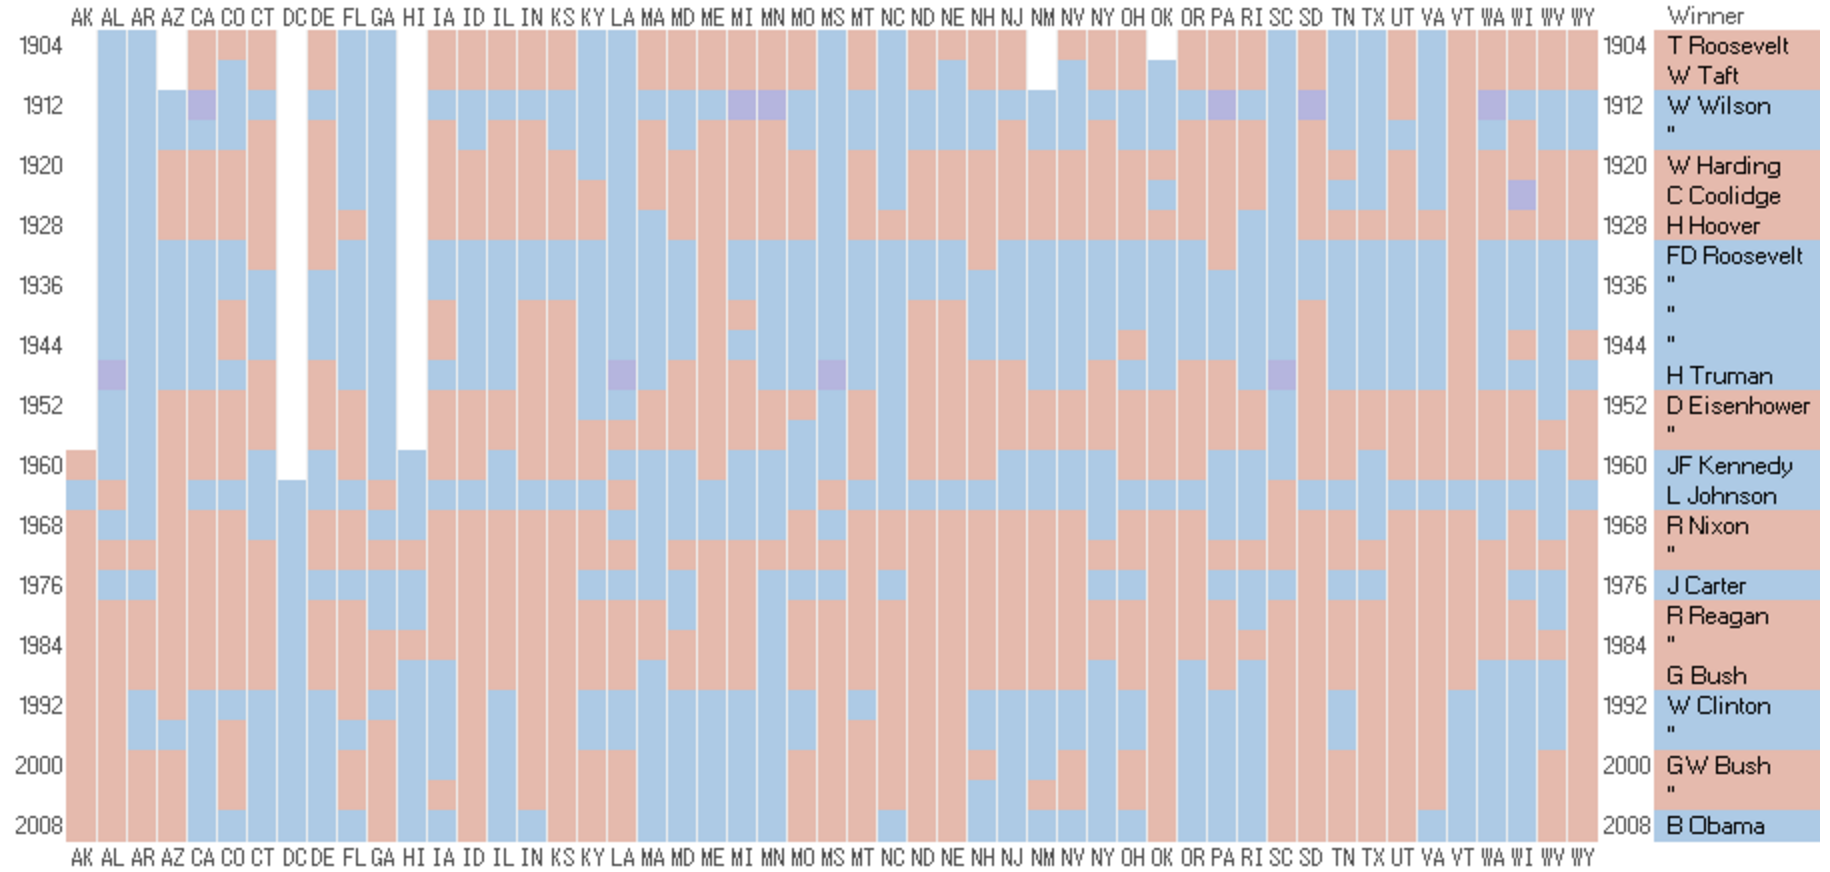
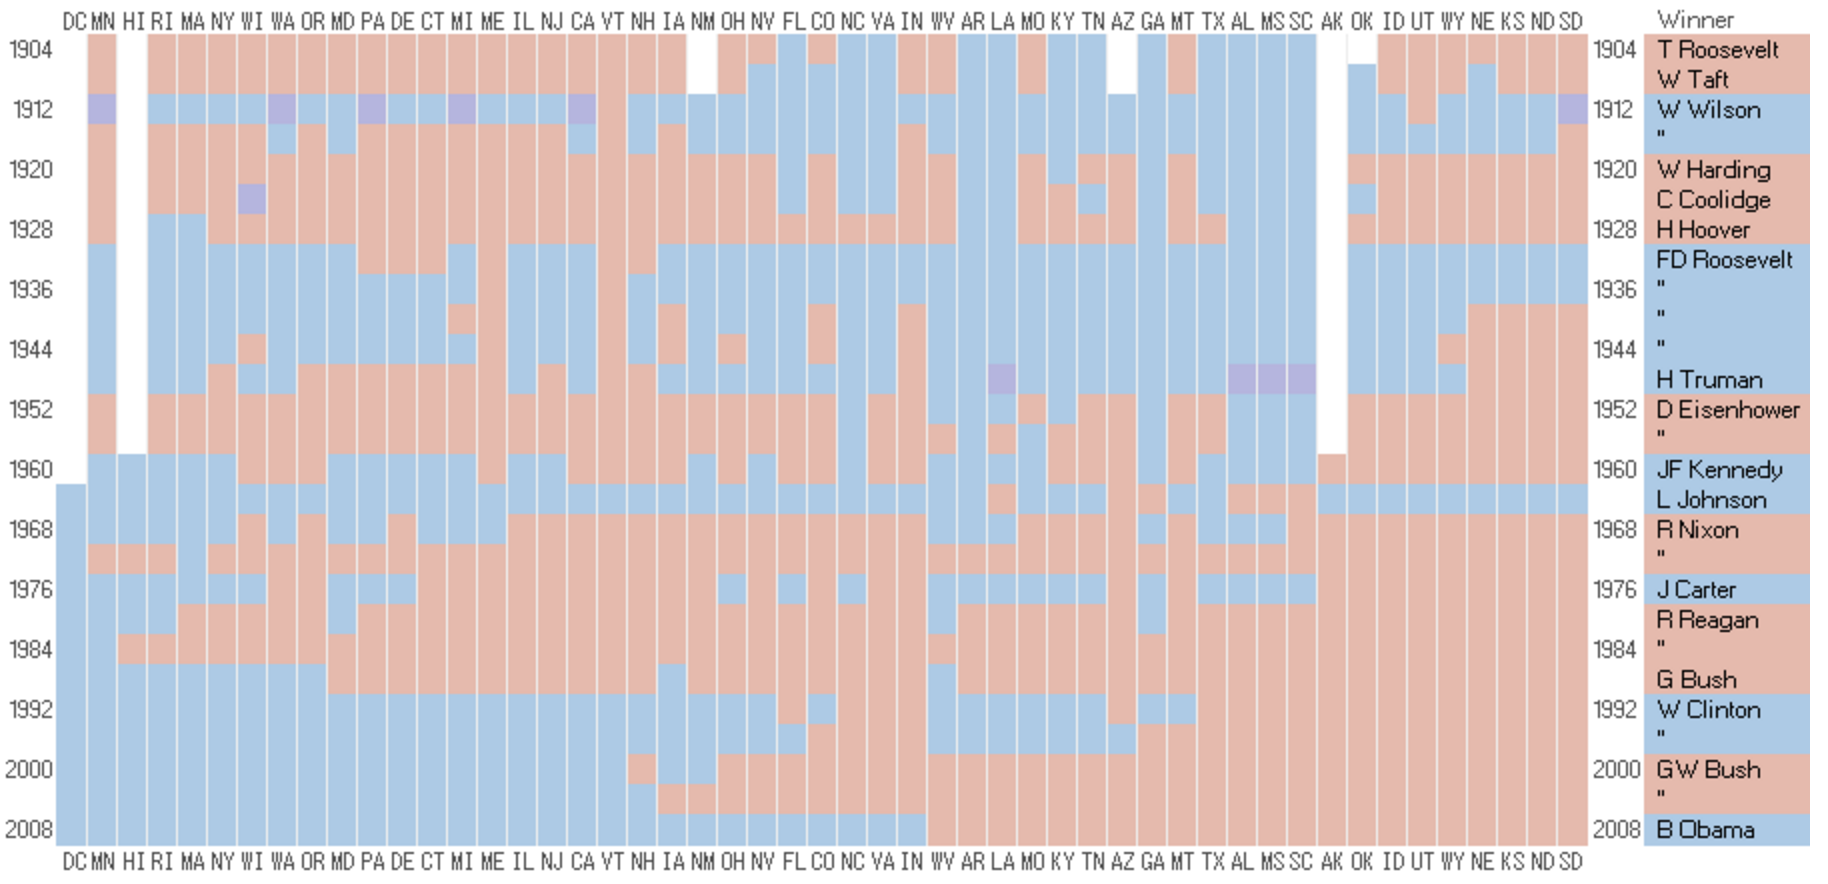
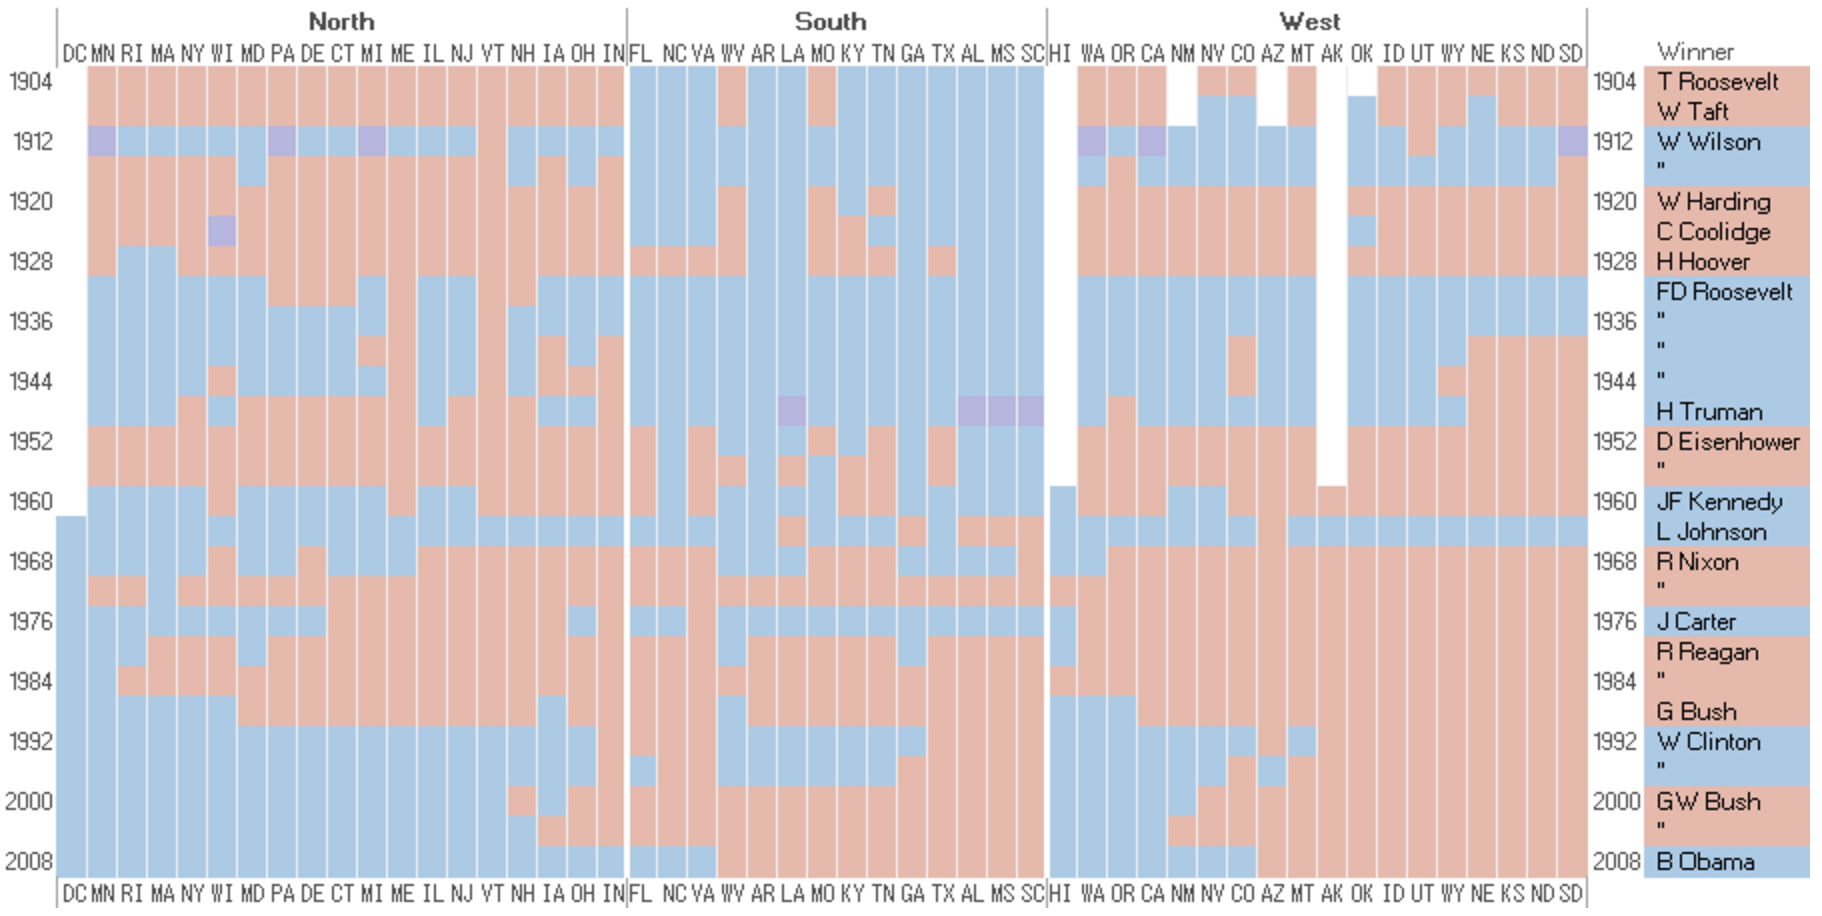
Results for US Presidential Election Sorting into chronological order reveals a pattern (image 2) and ordering the into three regions shows a clearer picture (image 3) ![]
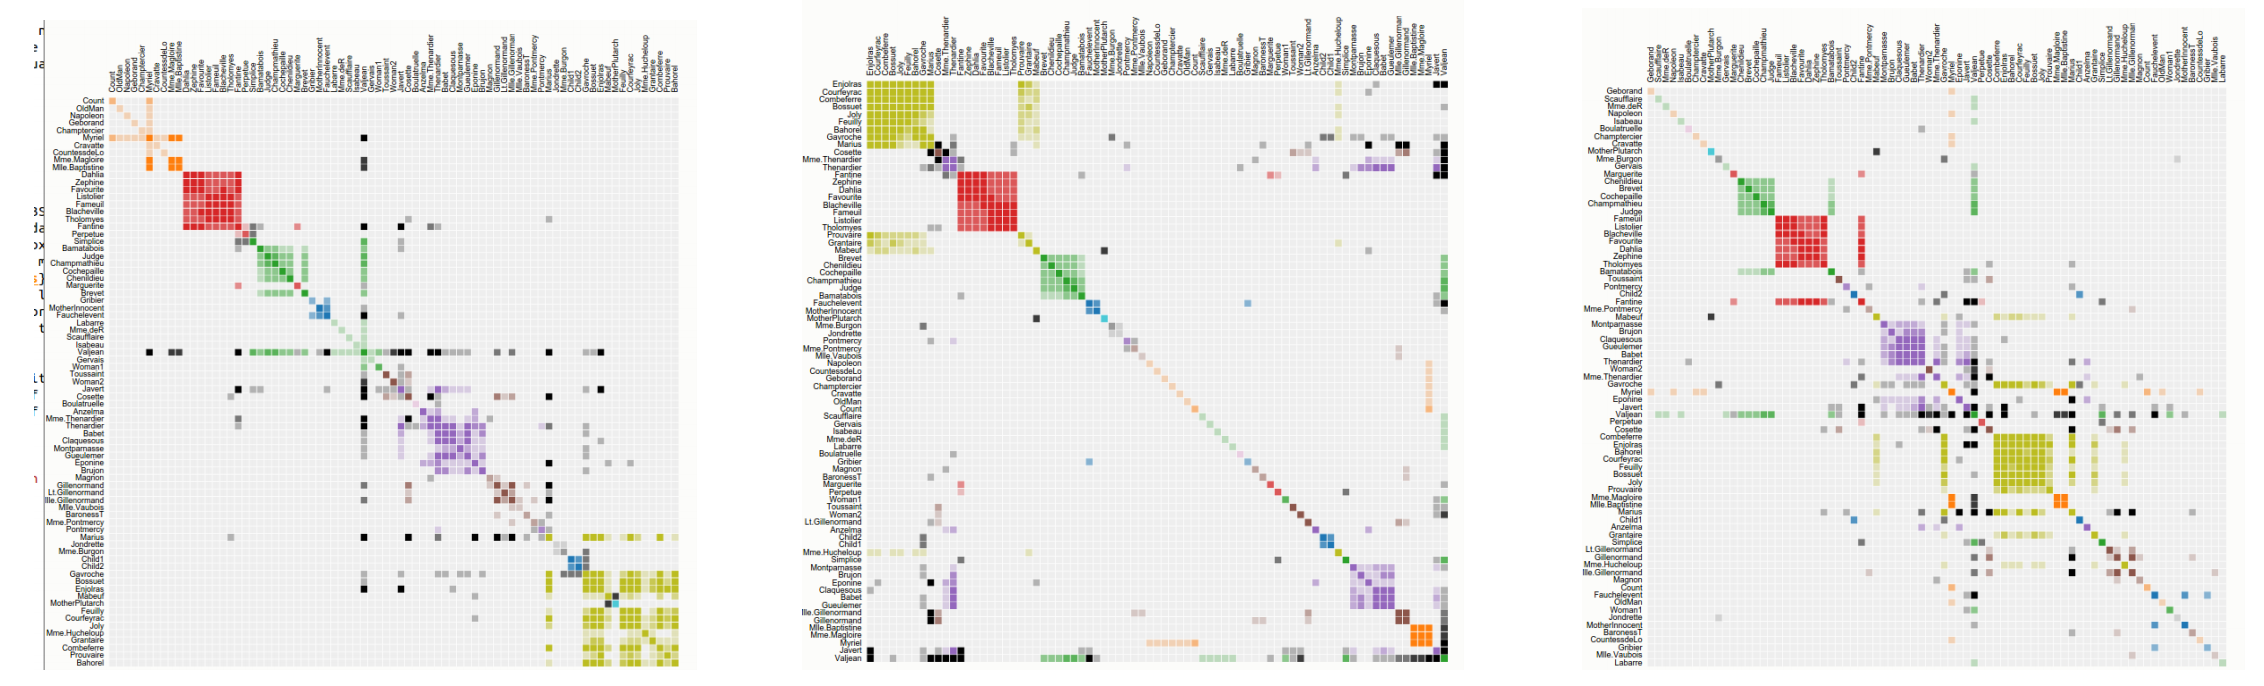
Reorderings of the Character-appearances Network in Victor Hugo's "Les Miserables"
Heat Map
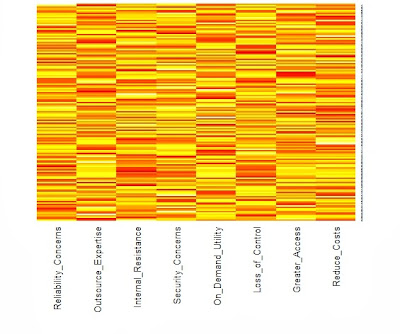

Hotel Occupancy Within Two Years Highlighted bars represent a value above a certain threshold. Indexing is arbitrary.