Linear and radial parallel coordinates
Parallel coordinates is a common way of visualizing high-dimensional geometry and analyzing multivariate data. Vertical bars represent each dimension. Each element of the data set has values for each dimension, which are shown as points along the vertical axis and then connected together.
Good parallel coordinates present clear
• Data structure • Data trend • Correlations
Good example 1:
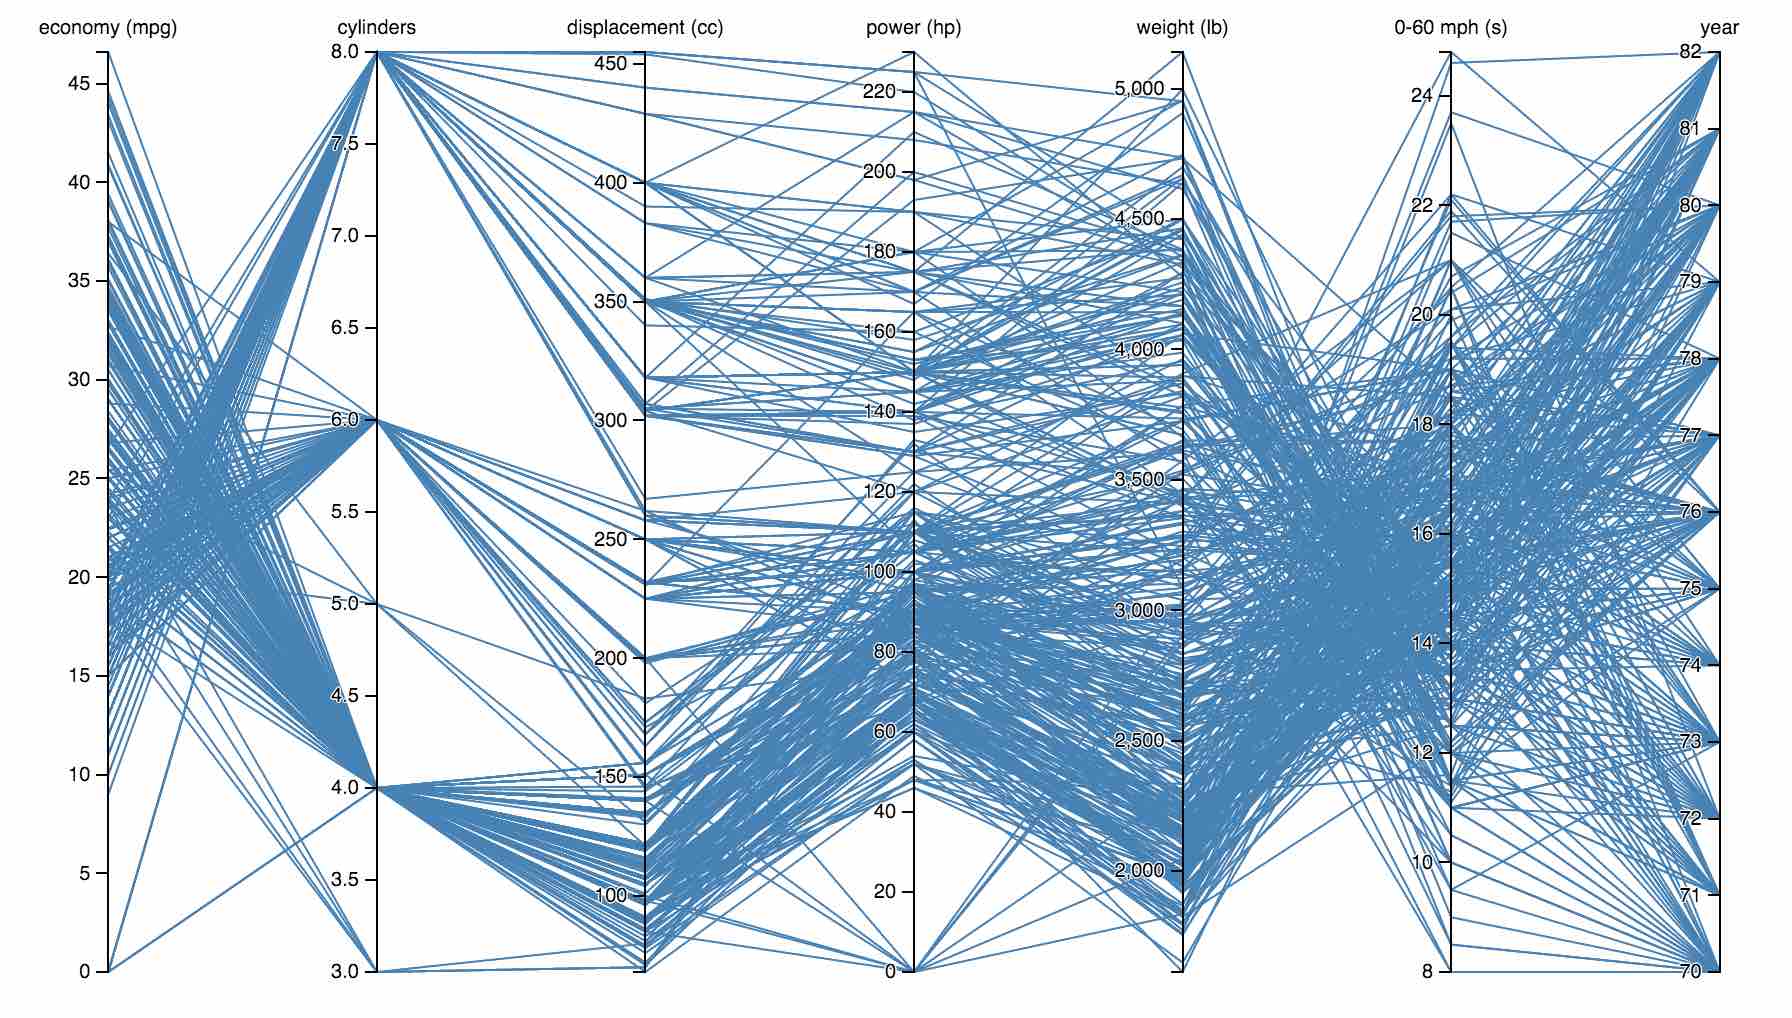
In the space between MPG and cylinders, you can tell that eight-cylinder cars generally have lower mileage than six- and four-cylinder ones. Just follow the lines and look at how they cross: lots of crossing lines are an indication of an inverse relationship, and that is clearly the case here: the more cylinders, the lower the mileage.
The correlation is much more direct between cylinders and horsepower: more cylinders means more horses. There are some crossing lines here as well, of course, so more cylinders do not always mean more power, but the general trend is clearly there.
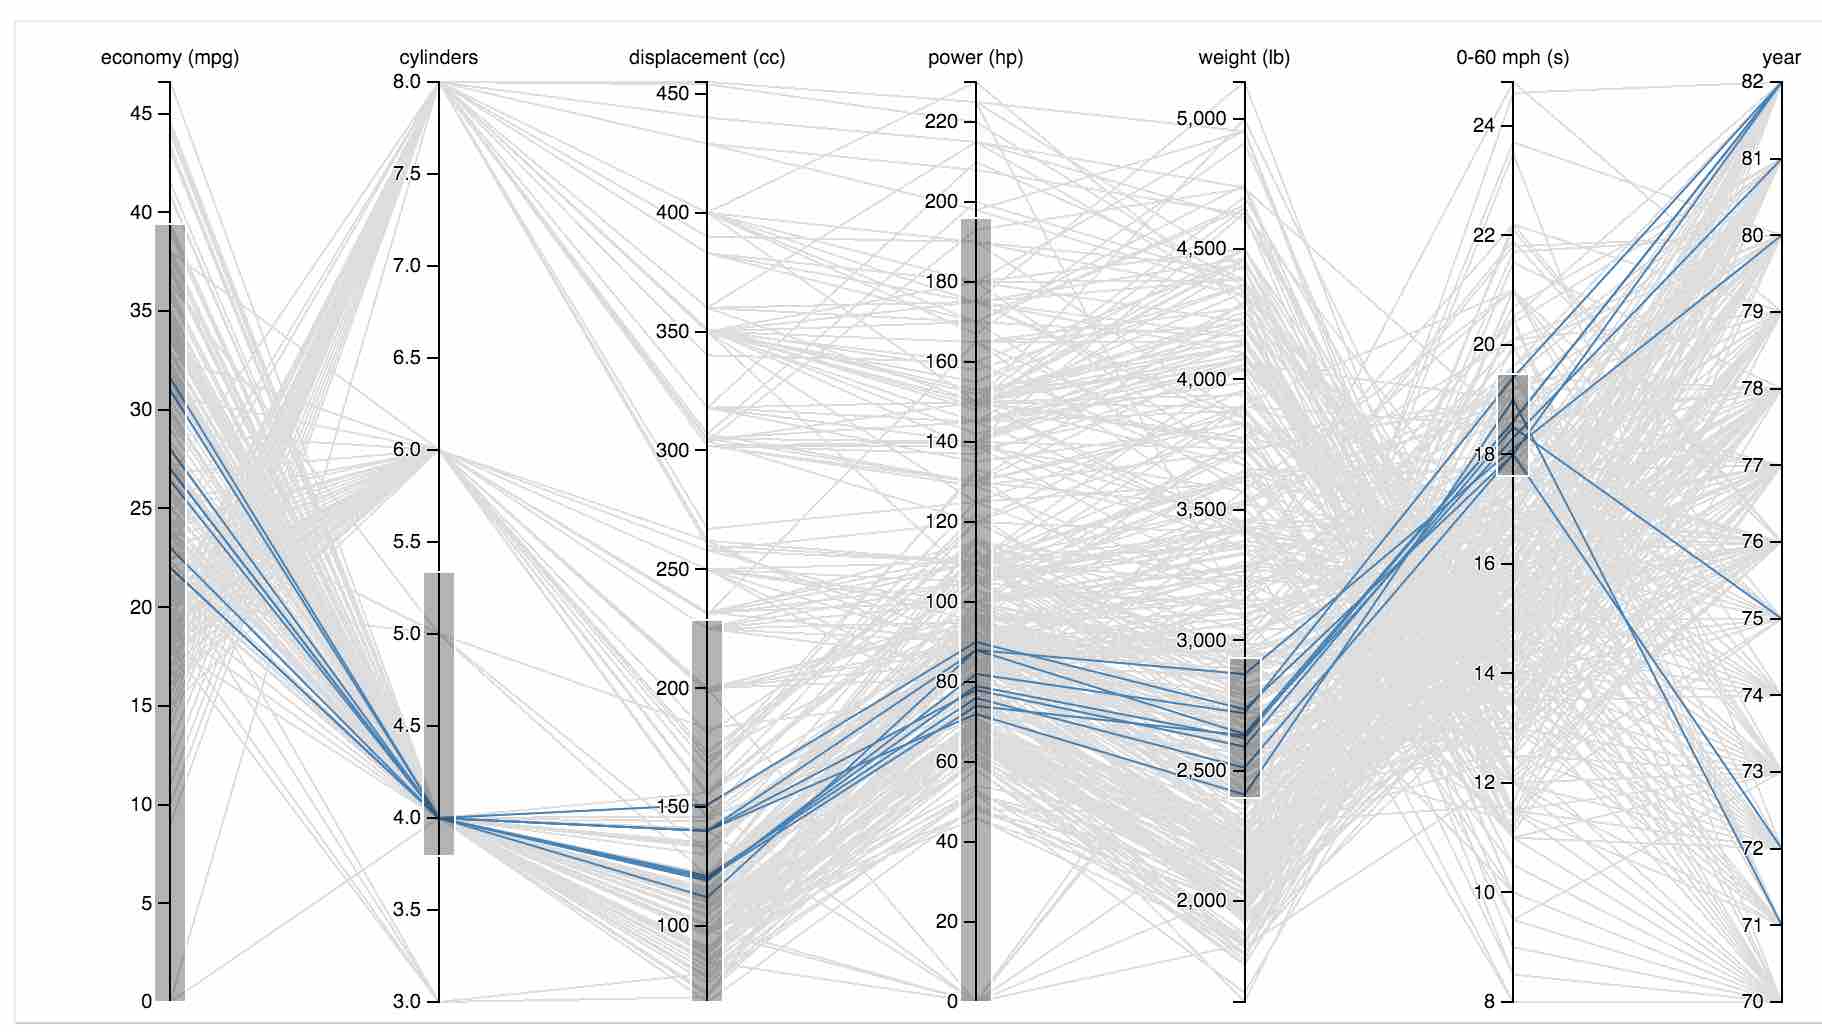
Good example 2:

Good example 3:

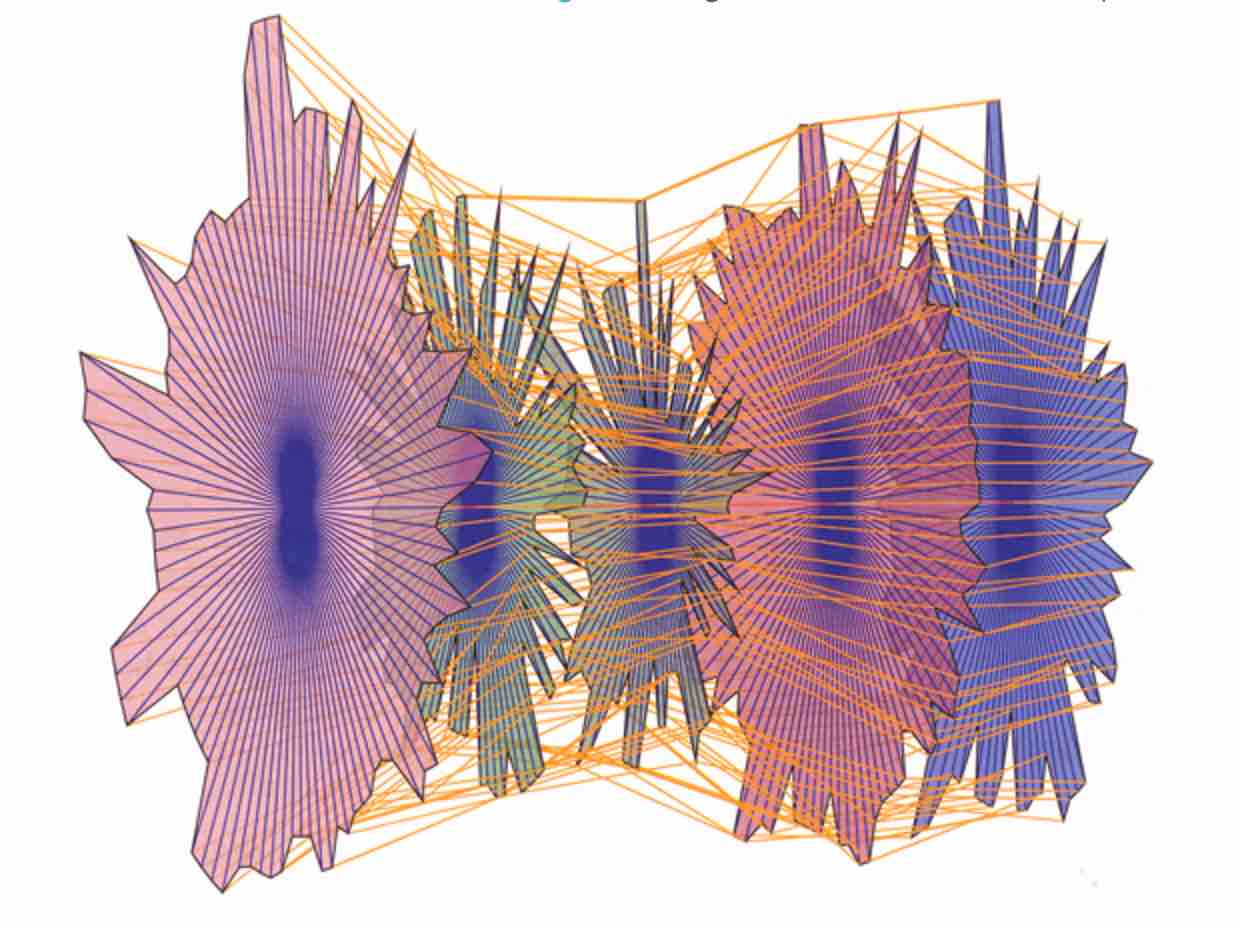
Radial parallel coordinates
A fairly large set of data is represented in a relatively small amount of space. If this were to be straightened out linearly the power and functionality would be lost. Within a small amount of visual space, many different stories are unfolding before our eyes. While we see that most information flows from the blue section highlighted, we also see very clearly that four sources come into it from the outside. Another quick understanding is that even though it seems to cover the most territory, the bar charts in the outermost ring shows us that relative to the other segments, the blue has the least activity in that only one bar of green stands out with a higher value. Even though we don’t know what this data represents, the quick inspection allows us to see relationships, and that’s what we’re after.
Most RCDs that I’ve come across so far are interactive. In this example, a hover over the blue fades out all the other segments so that you can concentrate on what relationships are shared by it.
Bad example 1:
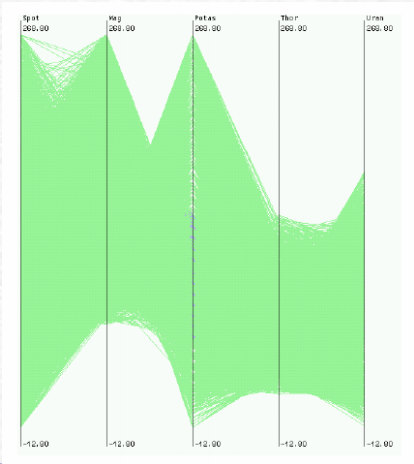
Bad example 2:

Bad example 3: