Isosurfaces
Isosurfaces can be used to create data maps that resemble topographies in 2D or 3D. They have traditionally been used in mathematics, engineering, and medical fields to represent heat distribution, fluid dynamics, or surface qualities of everything from equations to human bones. Water turbulence around a propeller, airflow around a spacecraft reentering the atmosphere, or (as seen below) building ventilation and heating can all be represented this way.
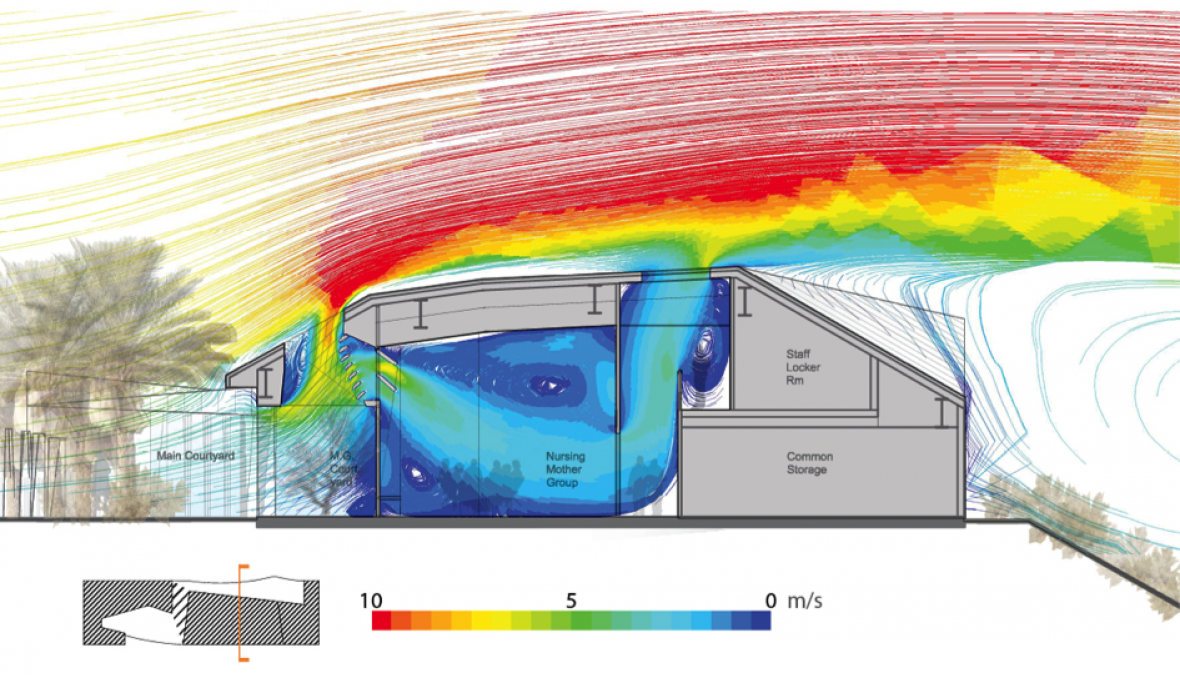 Air velocity around and within a naturally-ventilated building
 Passive-solar heat distribution within a lecture hall
While these visualizations can be very useful, they can also become confusing very quickly if colors and axes are used indiscriminately...

...or if the relationships depicted are unlabeled or decontextualized.

This idea of mapping with concentric surfaces, however, can also be used in very elegant ways outside of scientific applications. Interactive isosurface maps seem to have great potential for helping people visualize spatial relationships. This web-hosted map, for example, shows the the distance one can travel by bus from Portland's city center in any given increment of time. (For comparison, this somewhat more confusing map aims to do the same thing for Japan by morphing the geography itself rather than creating a spatial overlay.)
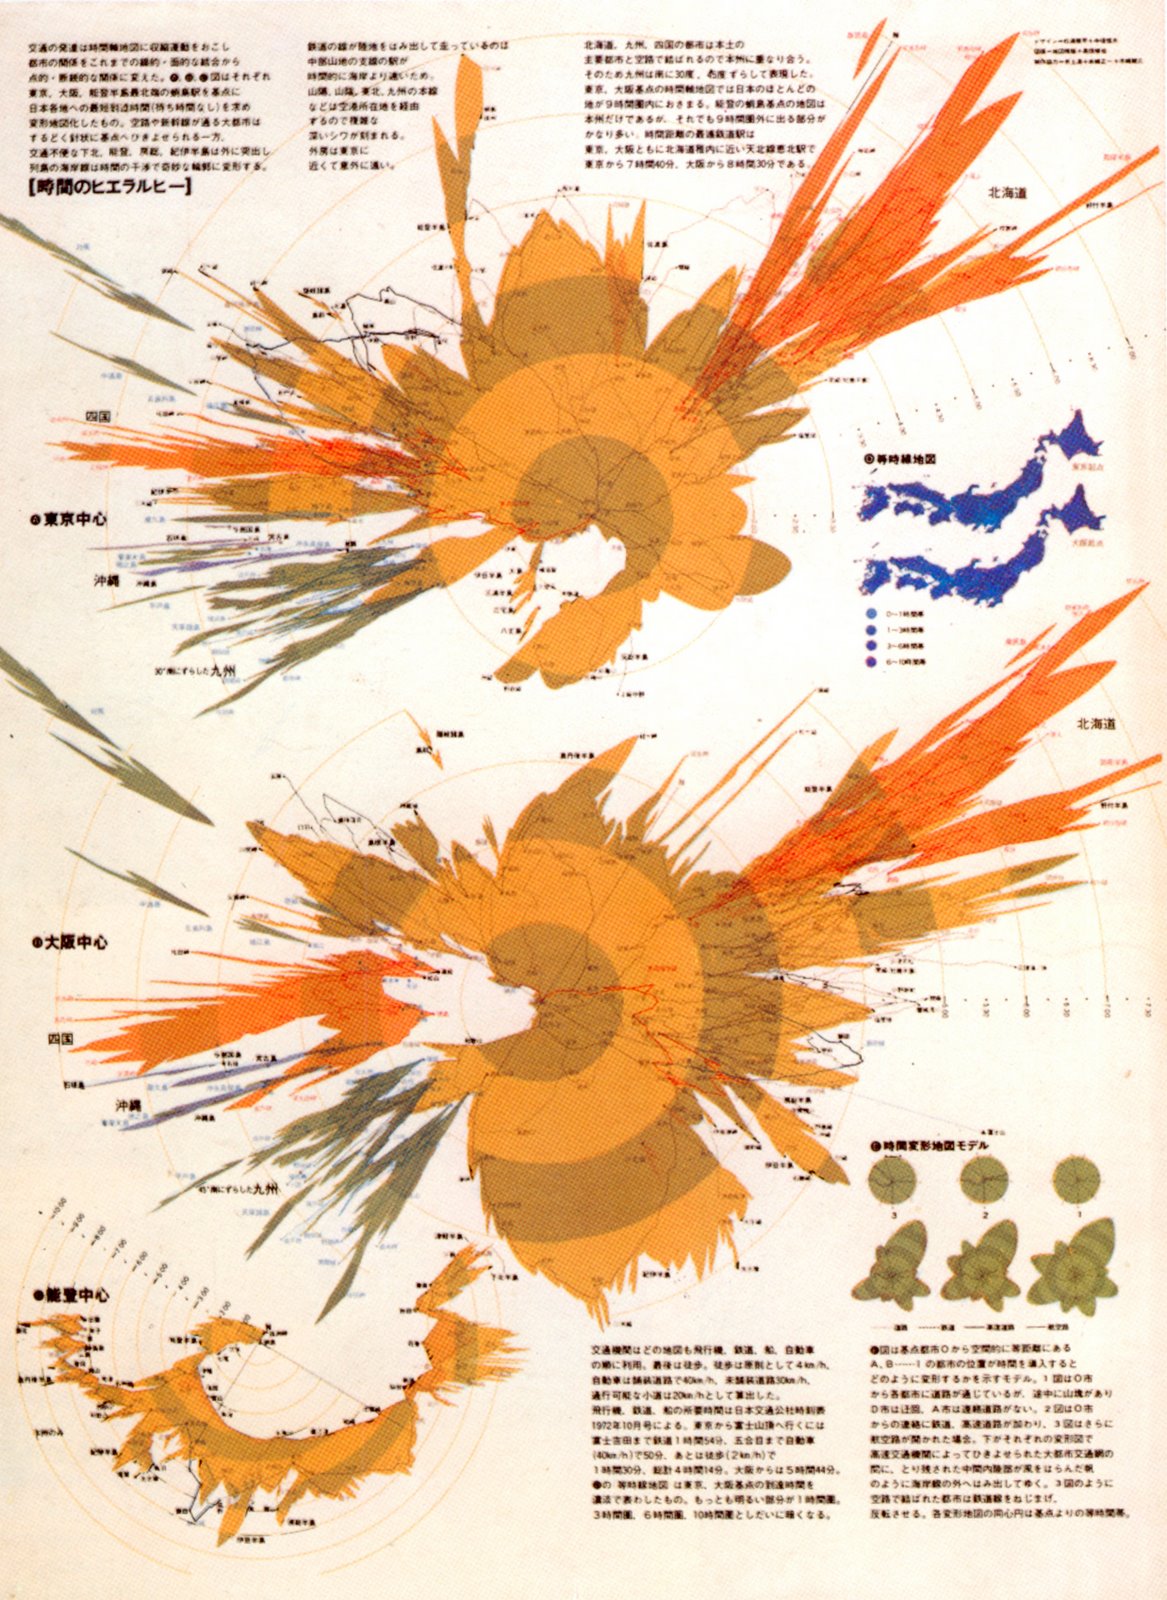
Finally, though I was not able to find examples of this, it may be possible to use isosurfaces to represent information that has both breadth and depth, with size of ring depicting breadth and number/height of rings depicting depth.