Dendogram
Dendrogram is best used for classification, probability, decision-making and hierarchy. These could be possible options, decision trees, probability growth, evolutionary growth, or generations. These are useful when it comes to determining how things differentiate while having certain things in common.
A dendogram needs to be visually efficient, in sense that it should display the information in the most visually pleasing way while not overwhelming the user with too much data or decisions.
Three particularly good examples include the following:
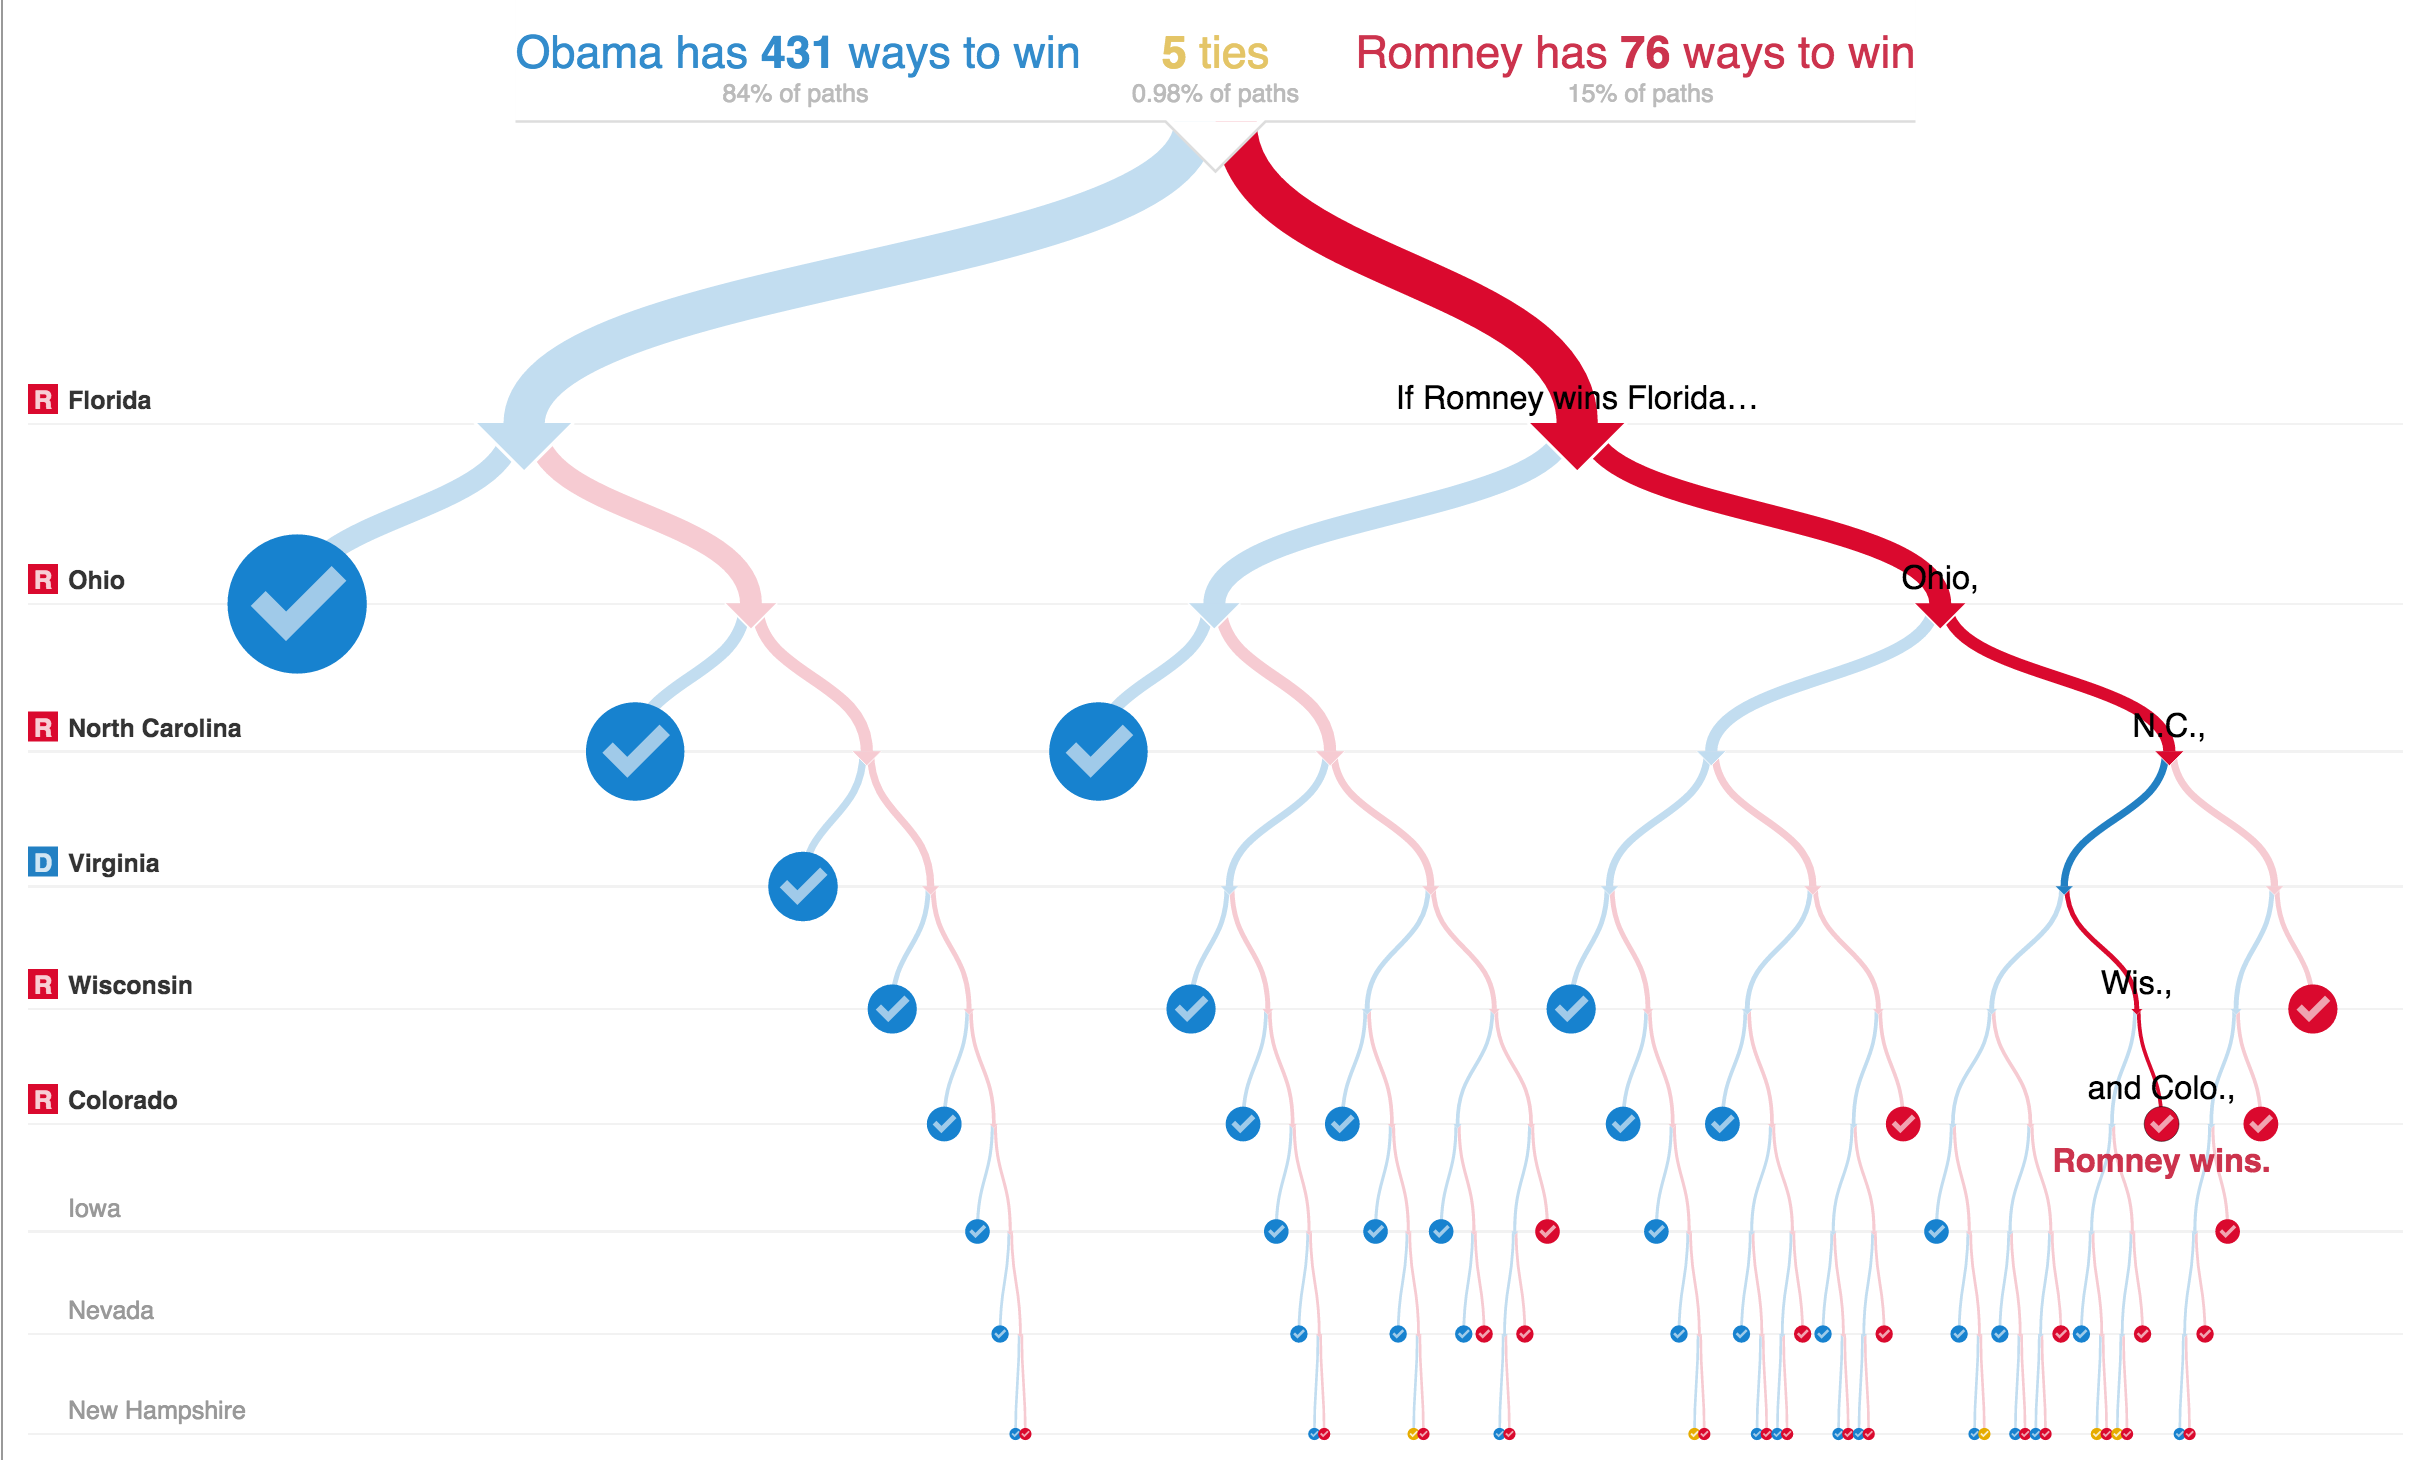
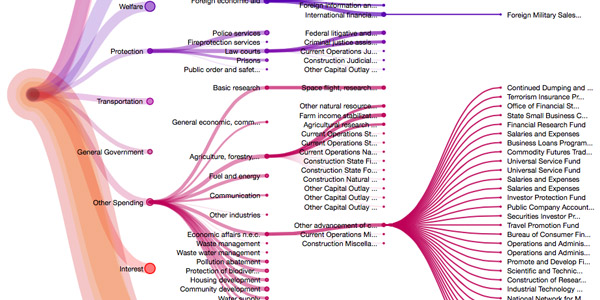
In number 4, despite being very data heavy, the information is presented spaced out enough not to overwhelm the user.
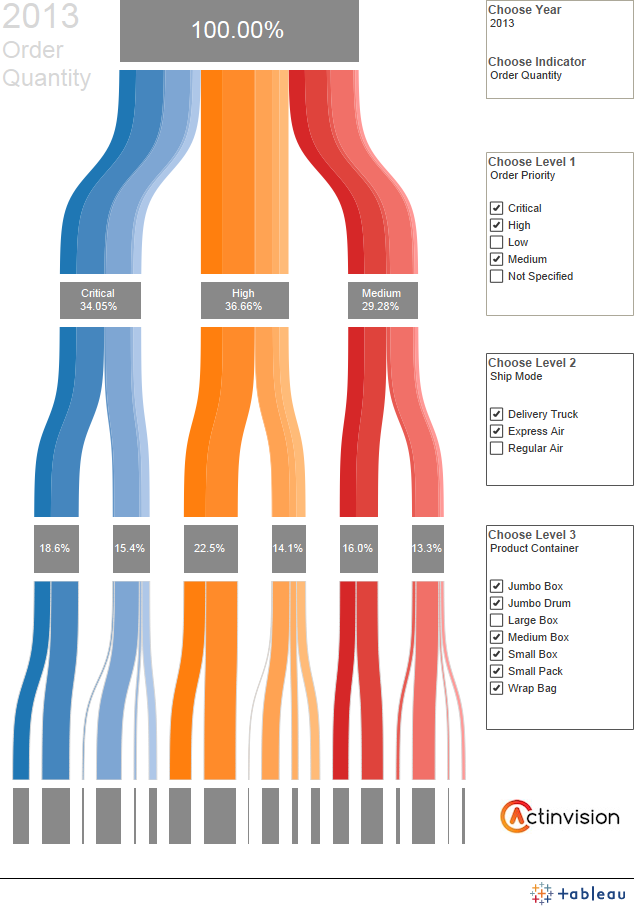
In this cases, there is too much information, but combined with the graph on the edge, it does overall redeem the graph.
Some bad examples include:
Too much information, not at all clear for the user.
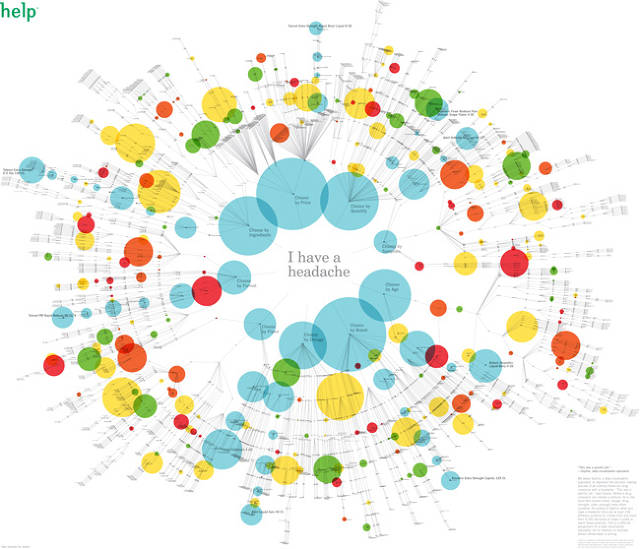
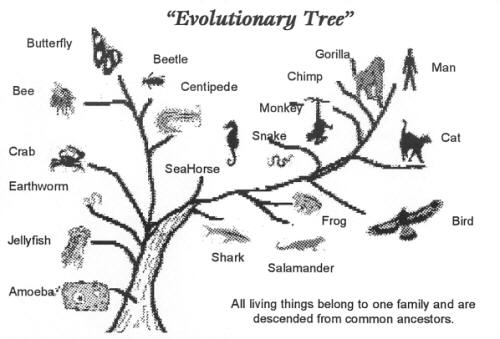
No classification, no information about the branches, and illegible writing.